Two friends each own a coffee shop in San Francisco County, CA. One of the coffee shops is located in the northern part of the county, while the other is located in the southern part of the county. These two friends want to maximize their customers trade area but they don't want to do it at the expense of the other coffee shop. They would like to know who their customers are and where they are coming from. In addition to their customers, these owners would also like to locate where their competitors are located.
Sources and Methods:
In order to get an understanding of what is going on, it is important to know where the customers are coming from to get their coffee. The figure below (Figure 1) shows where all the customers are located in relation to each coffee shop.
 |
| Figure 1. This shows the location of both coffee shops as well as the customers that frequent them. |
Once the customer locations are know, it is important to see where competing stores are located in relation to the coffee shops. The figure below (Figure 2) shows the location of the coffee shop's competitors.
 |
| Figure 2. This map shows the store locations of competing businesses. |
Although the customer's location can be useful, it may be more beneficial to create buffers around each coffee shop, showing the percentage of the customer base. The figure below (Figure 3) shows the customer base for each coffee shop.
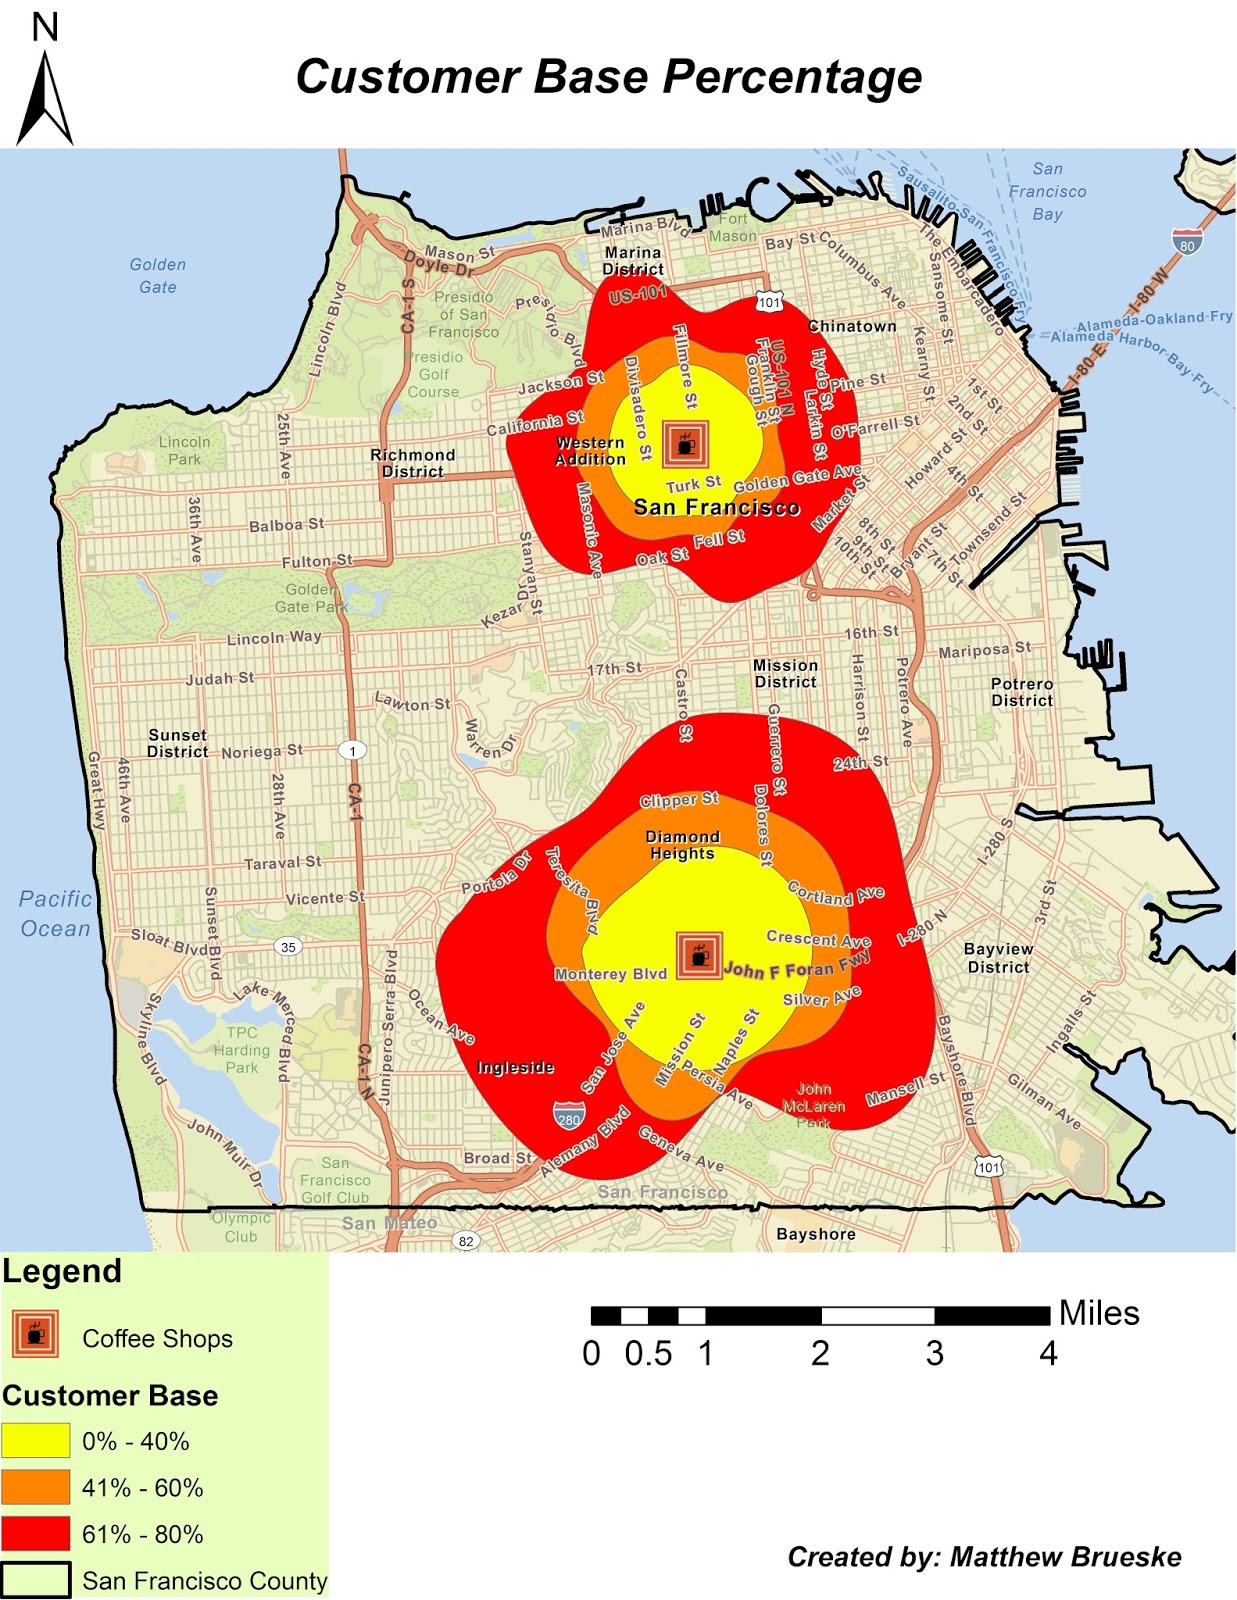 |
| Figure 3. This map shows where the customer base is for each coffee shop. |
The last factor to map out is the walk time for the different distances from the coffee shops. The figure below (Figure 4) shows the different walk distances.
 |
| Figure 4. This map shows the walking distance to each coffee shop. |
Conclusion:
Although it is important to be able see spatially where your customers are coming from, it is also important to understand the area's demographics. Relating back to figure 3, there are 146,836 people living in the 0-80% ring for coffee shop number 1. There are 160,222 people living in the 0-80% ring for coffee shop number 2. This is important to note because the more people living around your store, the greater chance you have to expand your customer base. The mean household income is also significantly higher around coffee shop number 2. It is roughly $30,000 more than compared to the customer base surrounding store number 1. With this higher amount of income, it may allow for these customers to have more money to spend at local coffee shops.
After looking at all of the different variables, coffee shop number 2 has the greatest chance to expand its customer base. This is largely due to the lack of competition in the surrounding area as well as a growing customer base. Both coffee shops can expand their trading areas without affecting the customer trading route of each other.